
1/ I've posted this kind of thing before: a flight of steps that is not tagged as steps in OSM.
But this time is different. This time, I didn't find the steps by randomly walking around Malaga. This time, I had A System.
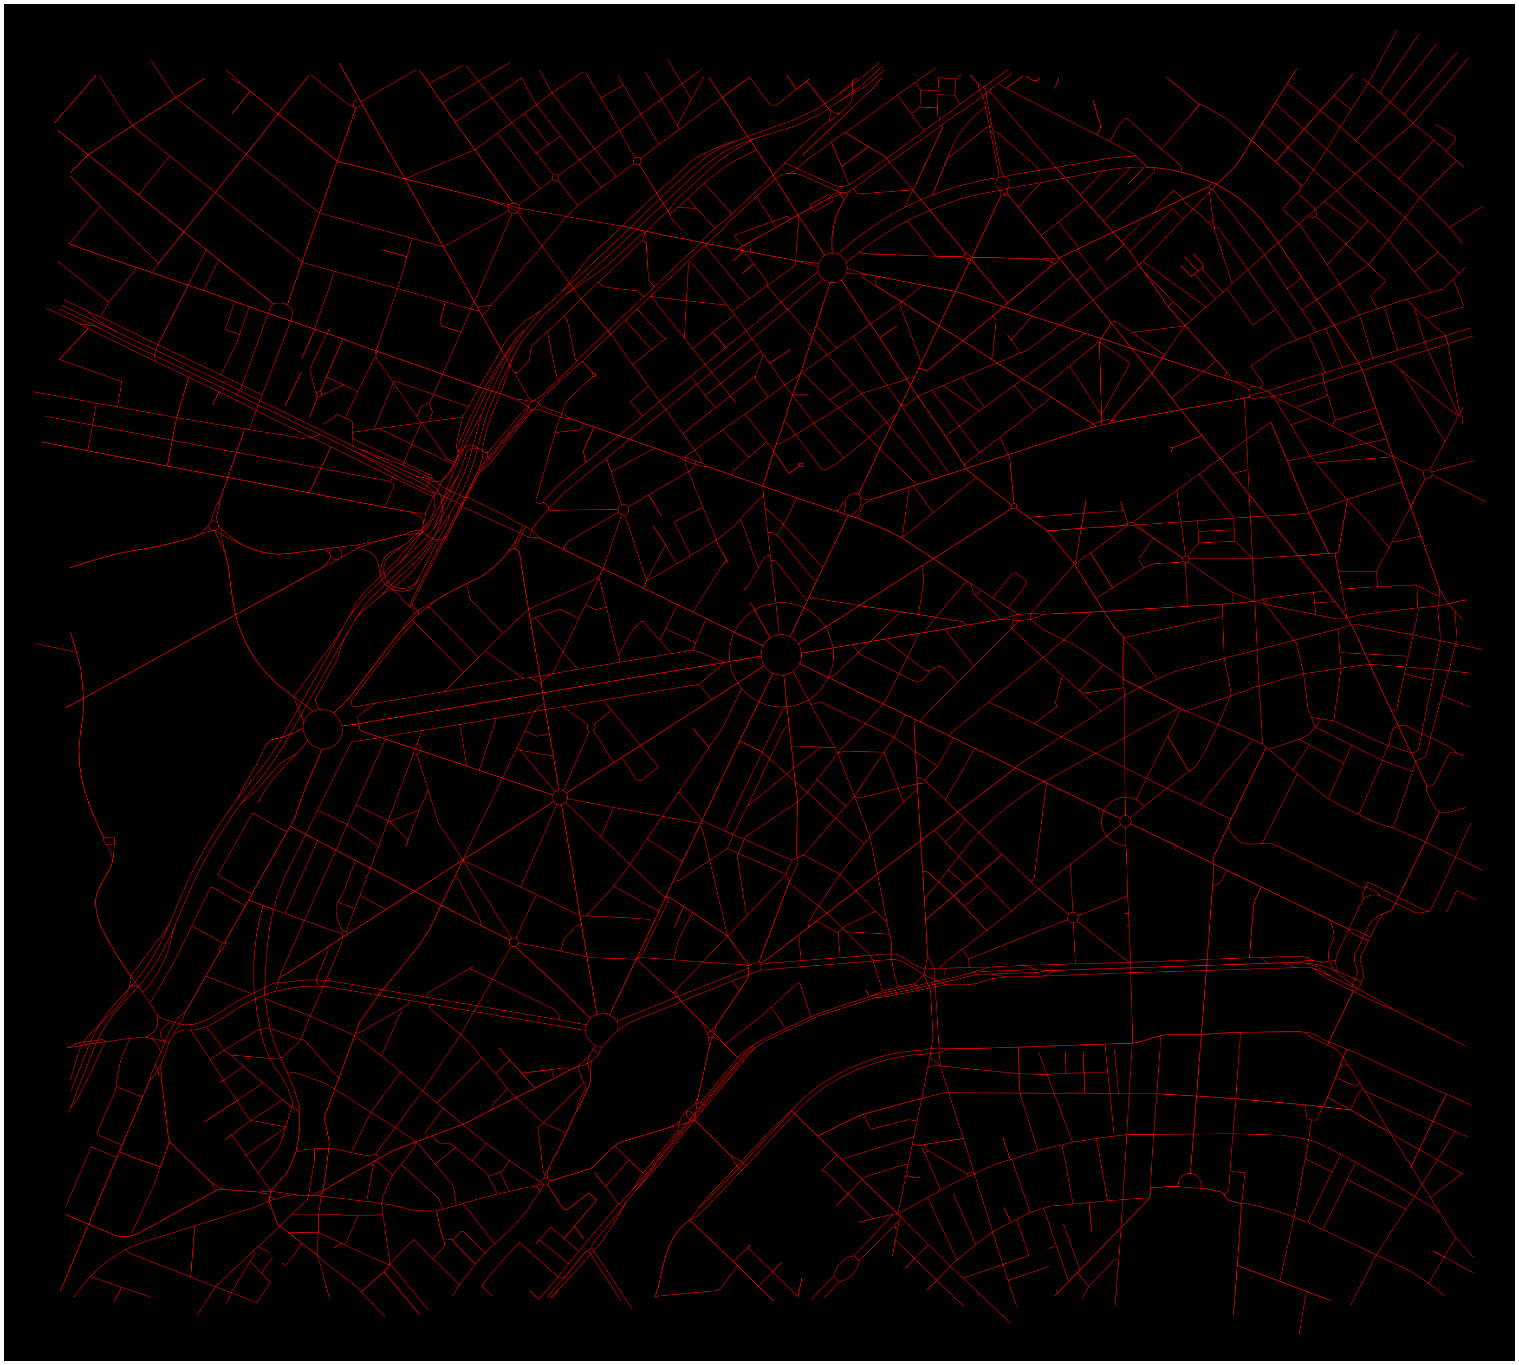
With the help of the OSMnx package and IGN elevation data, I was able to estimate gradients of street segments in OSM data. The example shows one barrio (Maqueda) that has a flat eastern part, and a western part built on both sides of a ridge.


")


 Code:
Code: 


, buildings (white) and piazzas (red) are shown. Above each circle is the city title, with the region name below. On the right-hand side is a map of Italy, showing the regions (in red) and the regional capitals are labelled in green. The whole figure has a black background.")


, and to the right the latitudinal distributions.")


 # a geopandas GeoDataFrame
gdf.plot()
plt.show()")