

binjr v3.23.0 is now available! 
The main feature for this release is an enhancement to the CSV files plugin to allow loading multiple files at once from a directory or directly from a zip archive, without the need to decompress it first!
It also leverages a new feature in the latest release of the #Java runtime to help reduce memory usage significantly, as well as bug fixes.
Full changelog and download links at https://binjr.eu
openjdk.orgJEP 450: Compact Object Headers (Experimental)


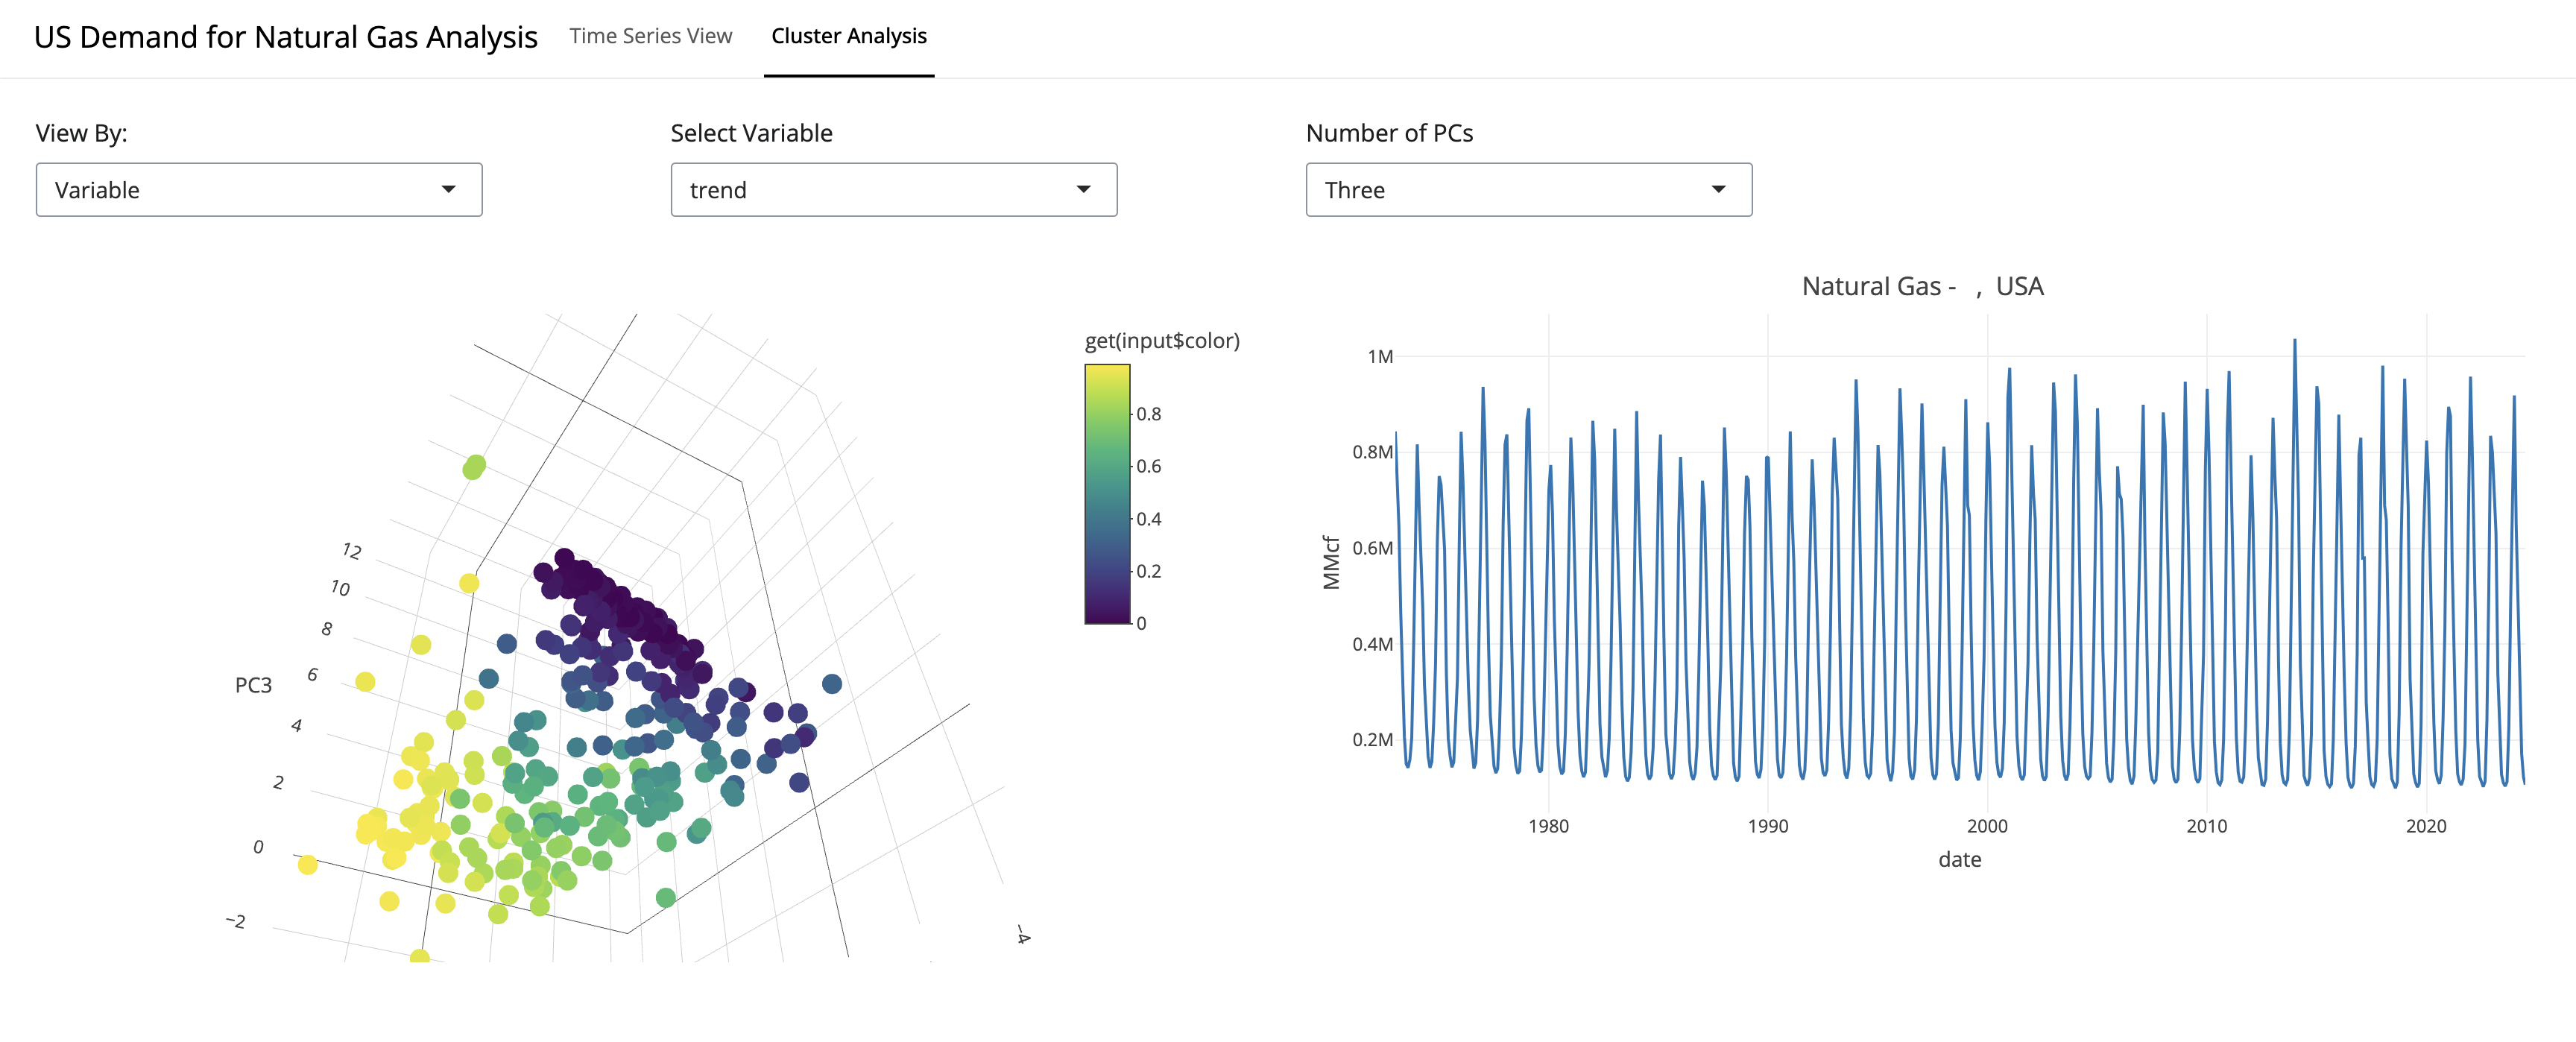
 𝐇𝐨𝐰 𝐓𝐨 𝐅𝐨𝐜𝐮𝐬 𝐎𝐧 𝐖𝐡𝐚𝐭 𝐌𝐚𝐭𝐭𝐞𝐫𝐬 𝐈𝐧 𝐓𝐢𝐦𝐞 𝐒𝐞𝐫𝐢𝐞𝐬 𝐅𝐨𝐫𝐞𝐜𝐚𝐬𝐭𝐢𝐧𝐠
 𝐈𝐧 𝐭𝐡𝐢𝐬 𝐄𝐩𝐢𝐬𝐨𝐝𝐞, 𝐲𝐨𝐮’𝐥𝐥 𝐥𝐞𝐚𝐫𝐧 𝐡𝐨𝐰 𝐭𝐨 𝐚𝐜𝐡𝐢𝐞𝐯𝐞 𝐭𝐡𝐚𝐭 with


 Greg Cocks

 AGB difference map (2019 AGB - 1990 AGB) with predictions from the ensemble model. a) Statewide scale. b) A mosaic of working forests and Adirondack Forest Preserve land south of Stillwater Reservoir, NYS. c) Allegany River area with a portion of Allegany State Park to the east of the river. d) Forest growth along the border of the Catskill Forest Preserve. Values are capped at ± 75 Mg ha−1 for display.")
 and the surrounding area in Newcomb, New York (full area extent mapped with black box in New York State panel). Pair-wise raster subtractions (values capped at ± 75 Mg ha−1 for display) highlight spatial patterns and magnitudes of differences between model predictions. Ensemble - Direct not shown because it duplicates Indirect - Ensemble. A 1 m LiDAR-derived canopy height model and 0.5 m natural color National Aerial Imagery Program (NAIP) orthophotography included for additional reference information. All surfaces represent conditions in 2015.")


 and autumn (Panel B) images (RGB: 743) for the study area. Subset region marked in black frame. Panels C-F show uncorrected (panel C), corrected summer image using the enhanced C-correction (panel D) or the physical model (panel E), and the corresponding illumination condition (F). Panels G-J show the same as panel C-F, but for the autumn image. The QA layers generated from FORCE were not applied here.")
![map - Forest cover classification agreement among the 18 sets of input variables. Pixels in red color were classified by all sets of input variables as coniferous, in green color as broadleaf forest, and in blue color as mixed forest. Black color indicates that no forest was predicted by any set of input variables. Two subsets A and B which are marked in white frames were zoomed in for a detailed map comparison in [another figure]](https://files.techhub.social/media_attachments/files/113/587/524/174/644/700/original/103e6bd0b3300ee4.jpg "map - Forest cover classification agreement among the 18 sets of input variables. Pixels in red color were classified by all sets of input variables as coniferous, in green color as broadleaf forest, and in blue color as mixed forest. Black color indicates that no forest was predicted by any set of input variables. Two subsets A and B which are marked in white frames were zoomed in for a detailed map comparison in [another figure]")


 AI底層數據建模
  Thread)


 Map showing the Narragansett Bay Long-Term Plankton Time Series sampling site in Narragansett Bay, Rhode Island USA. (B) Subplots represent weekly data (open circles) and time series mean (black line) for the following parameters; temperature (1959 to 2019), light (1959 to 2019), salinity (1959 to 2019), silicate (SiO4, 1959 to 2019), phosphate (PO4, 1959 to 2019), ammonium (NH4, 1972 to 2019), and nitrate/nitrite (NO3/2, 1959 to 2019). Note: outlier values were removed (n < 10) to better illustrate seasonal signal.")